9 Monitoring and 3rd party libraries
In this chapter, we are going to wrap up this book on using AWS CDK for managing infrastructure as code. We will cover two topics in this chapter:
Monitoring infrastructure
Finding and using 3rd party libraries for AWS CDK
By the end of this chapter, you will know more about setting up monitoring and alarms for your infrastructure, and you will know more about finding useful libraries, not only from the core AWS CDK team.
The infrastructure we will monitor is based on what has been defined from previous chapters.
9.1 Finding and using 3rd party libraries for AWS CDK
Currently, one of the best places to find libraries and resources for use with AWS CDK, or any other CDK (CDKTF, CDK8s) is Construct Hub.
It is a website which contains information about many CDK construct libraries, including the standard ones from AWS, 3rd party libraries and generated constructs for public CloudFormation registry modules.
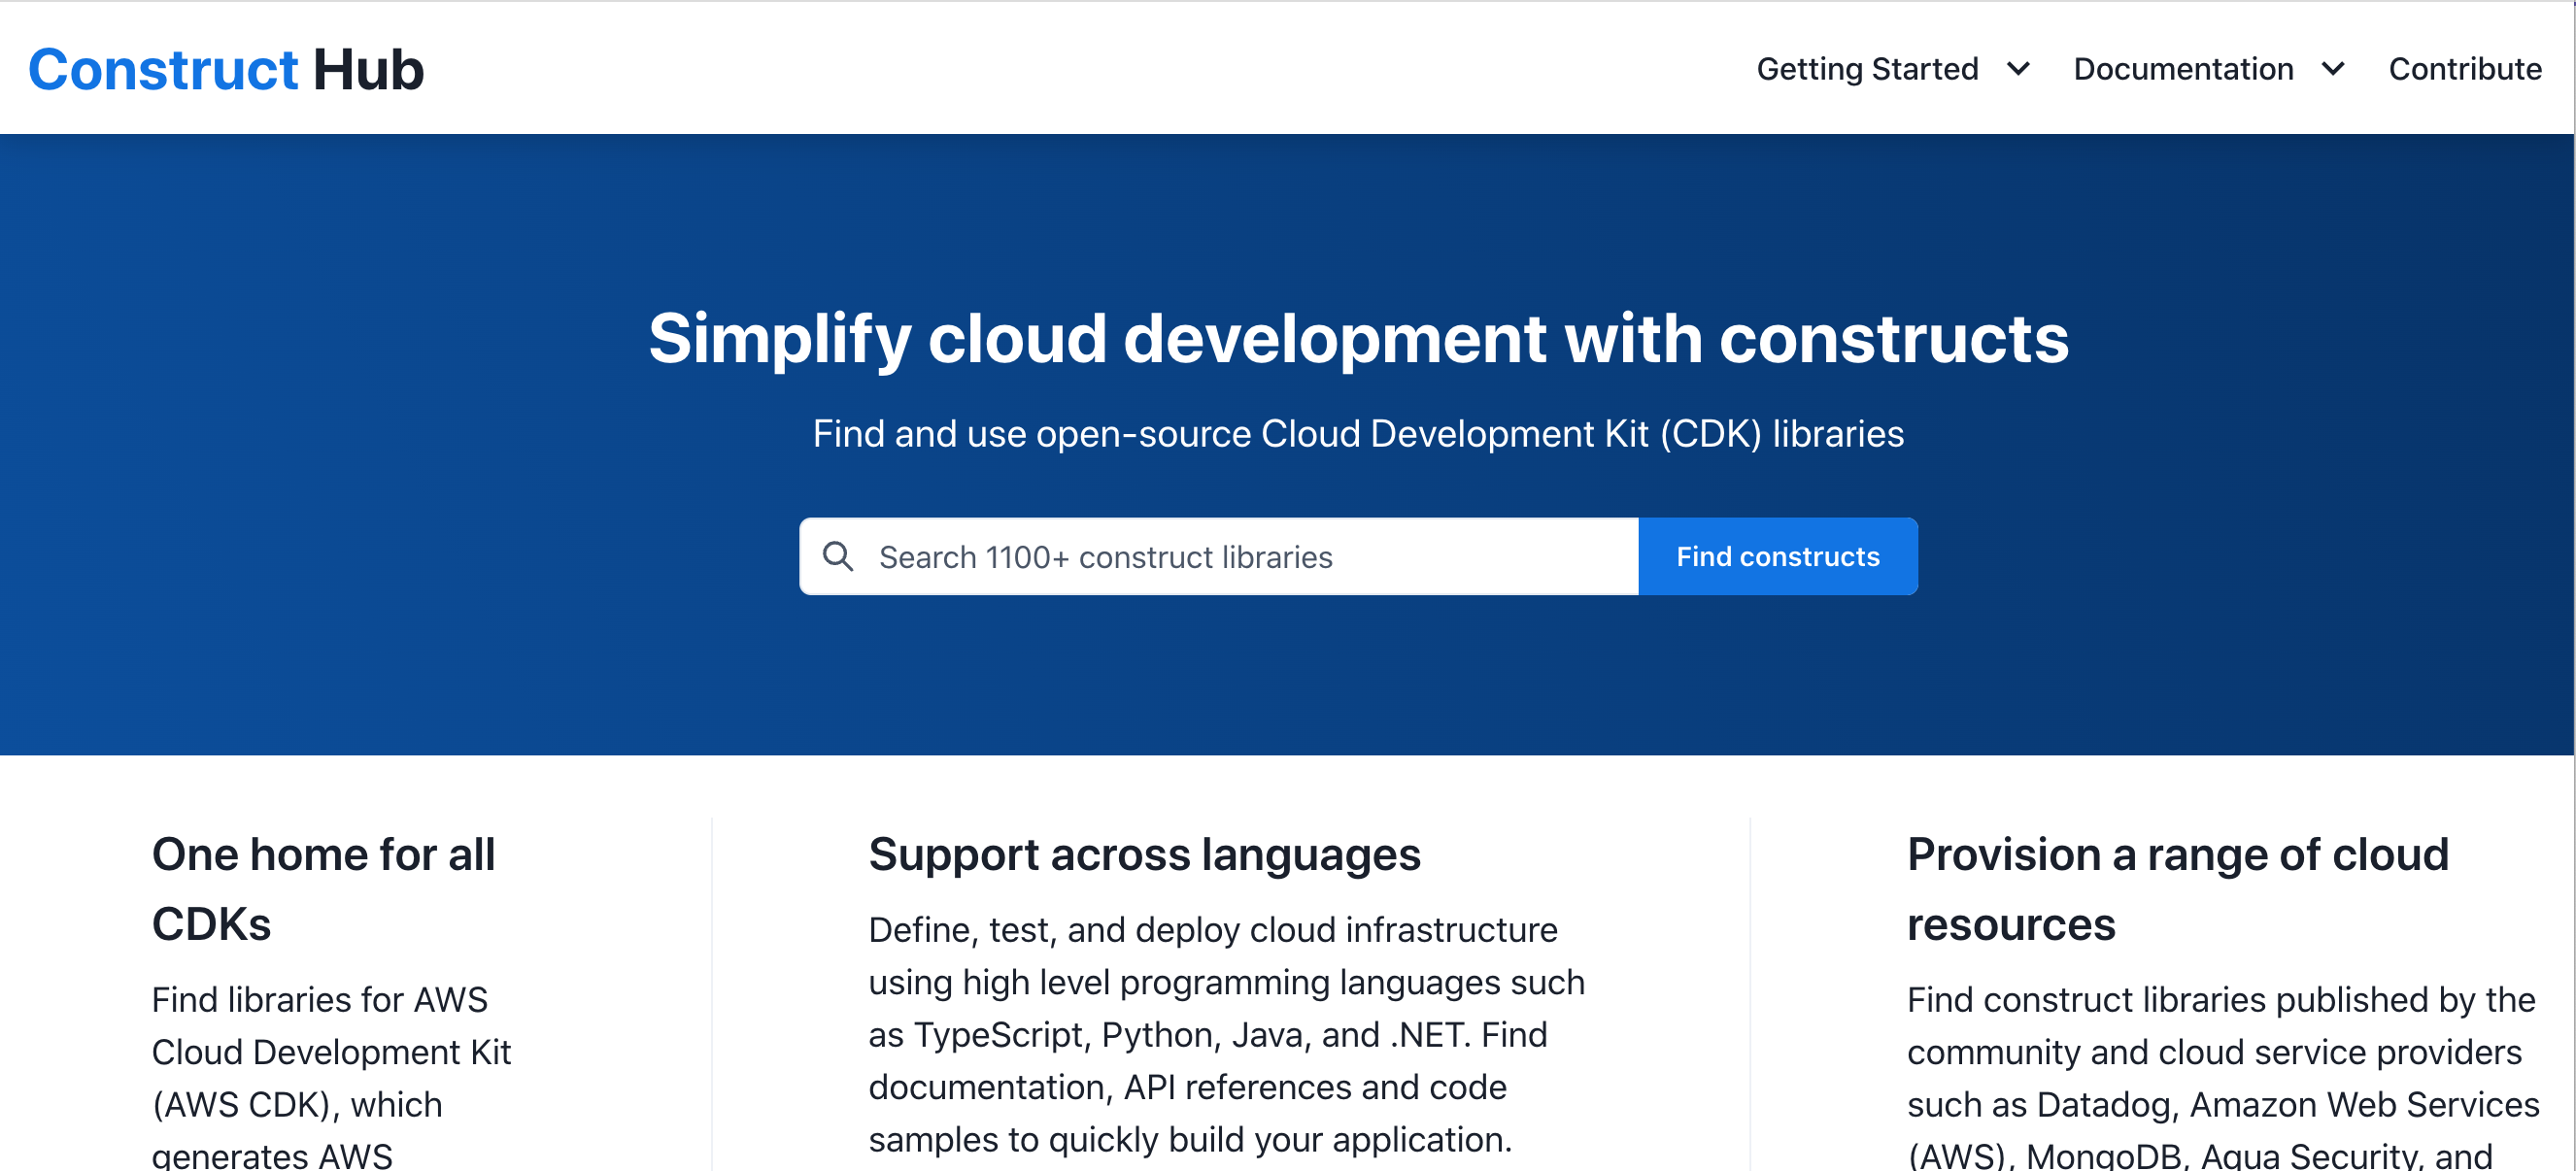
Since we are going to set up some monitoring for our infrastructure, let us search for monitoring and see what we get…
The first one in the search result is a library called cdk-monitoring-constructs, which sounds pretty promising. Other results include something for DataDog. There are many other hits for the term monitoring as well. However, for now, let us look at cdk-monitoring-constructs.
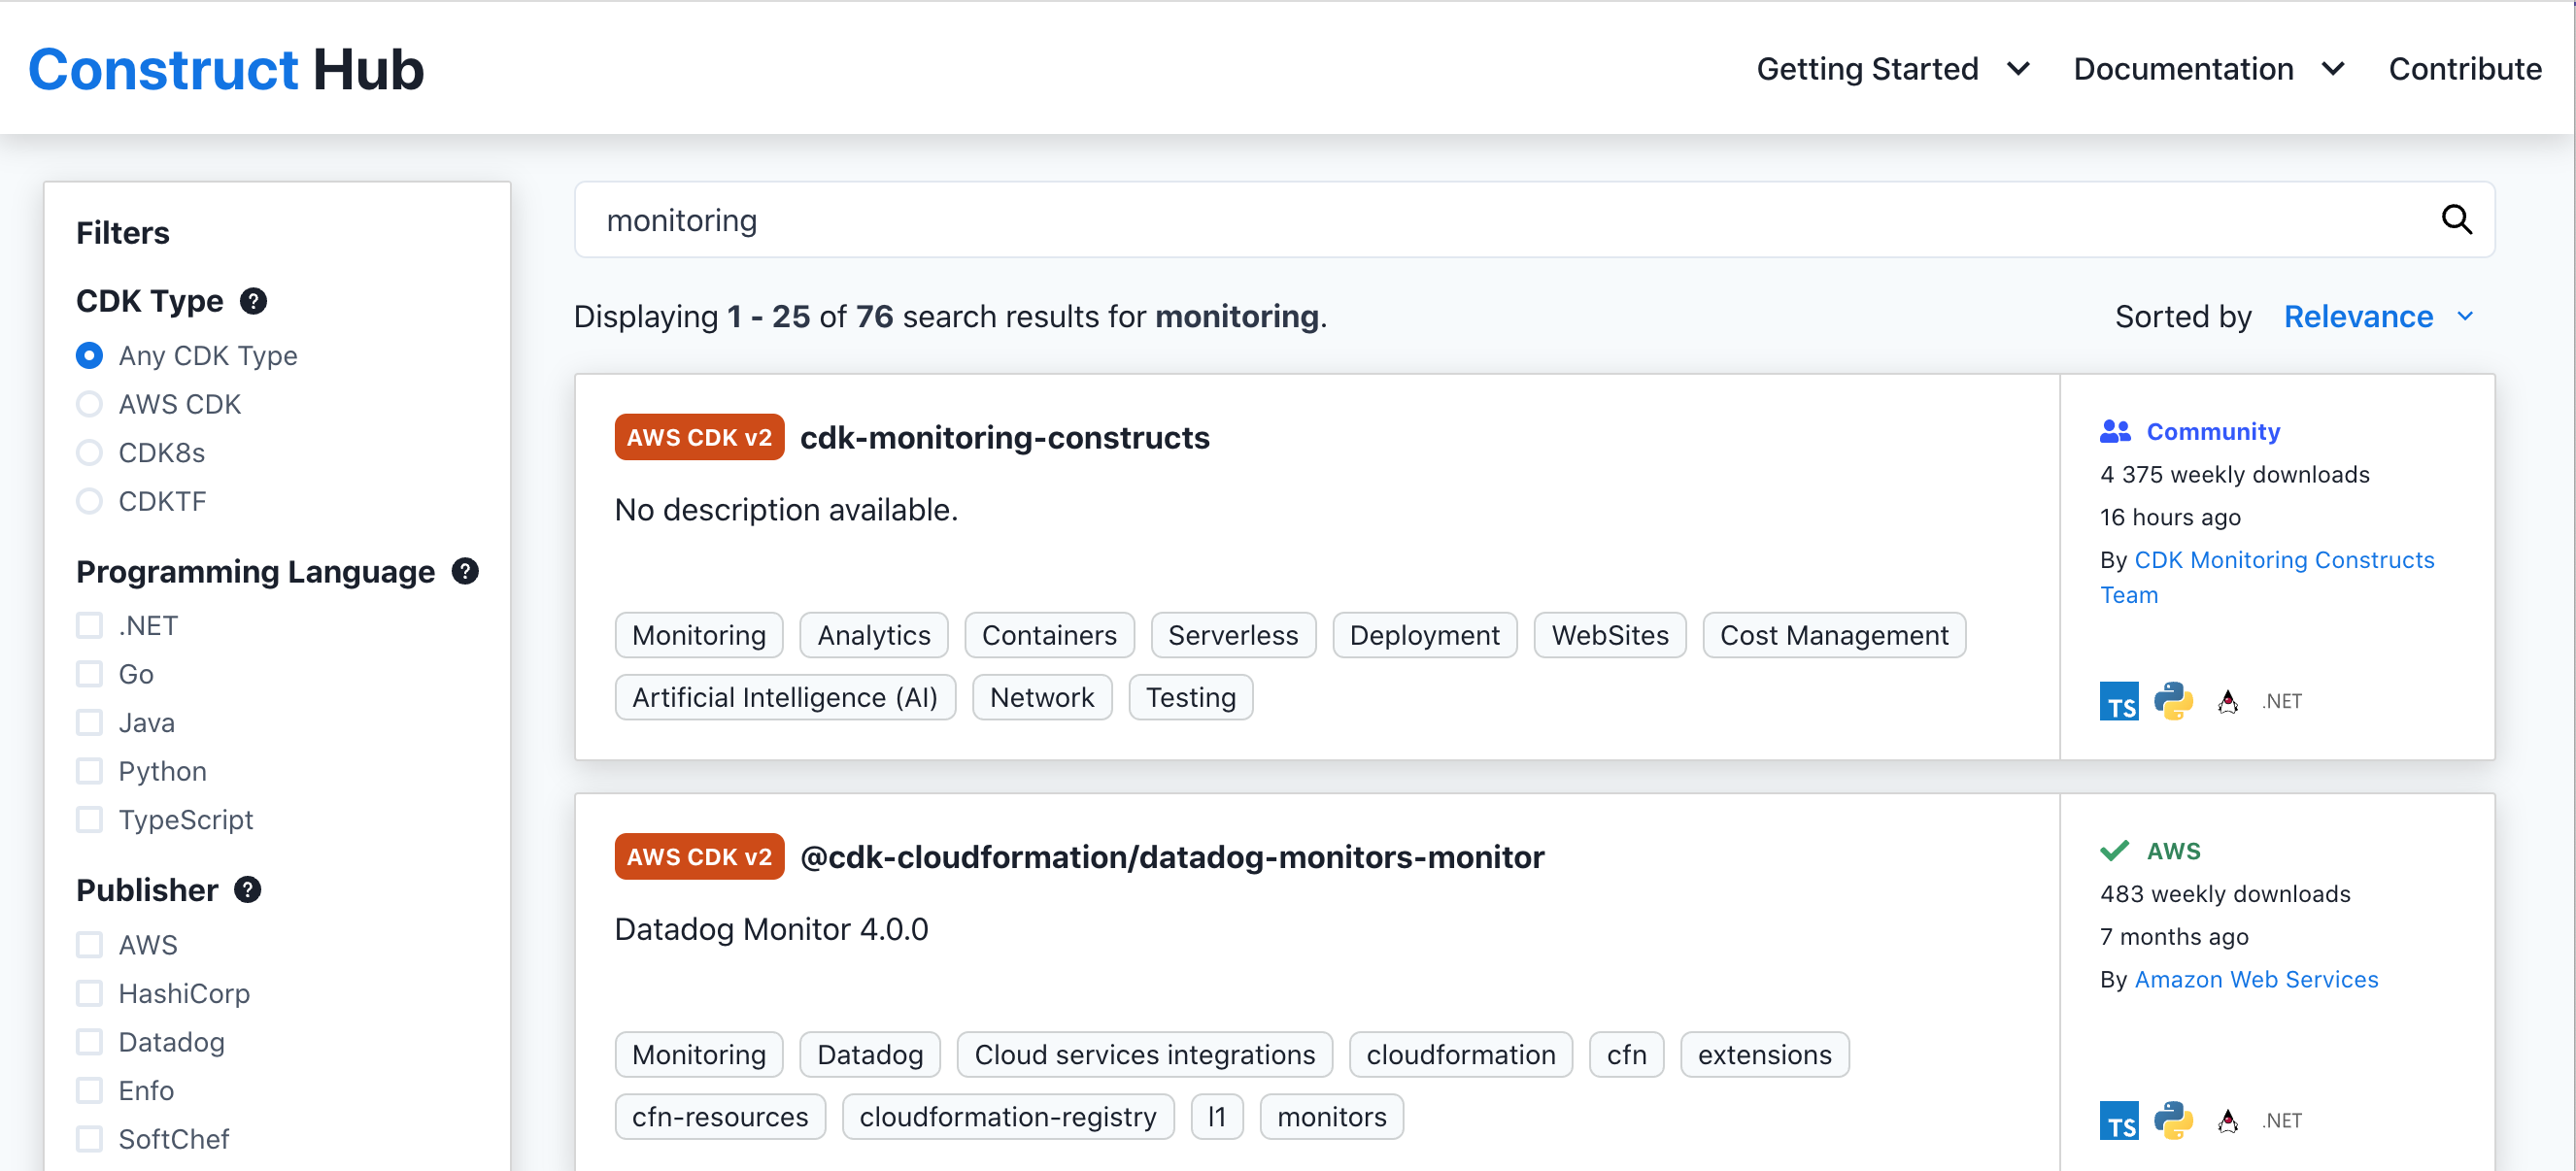
We can see from the symbols that this library is available for Typescript, Python, Java and .NET (C#). No Go though (yet).
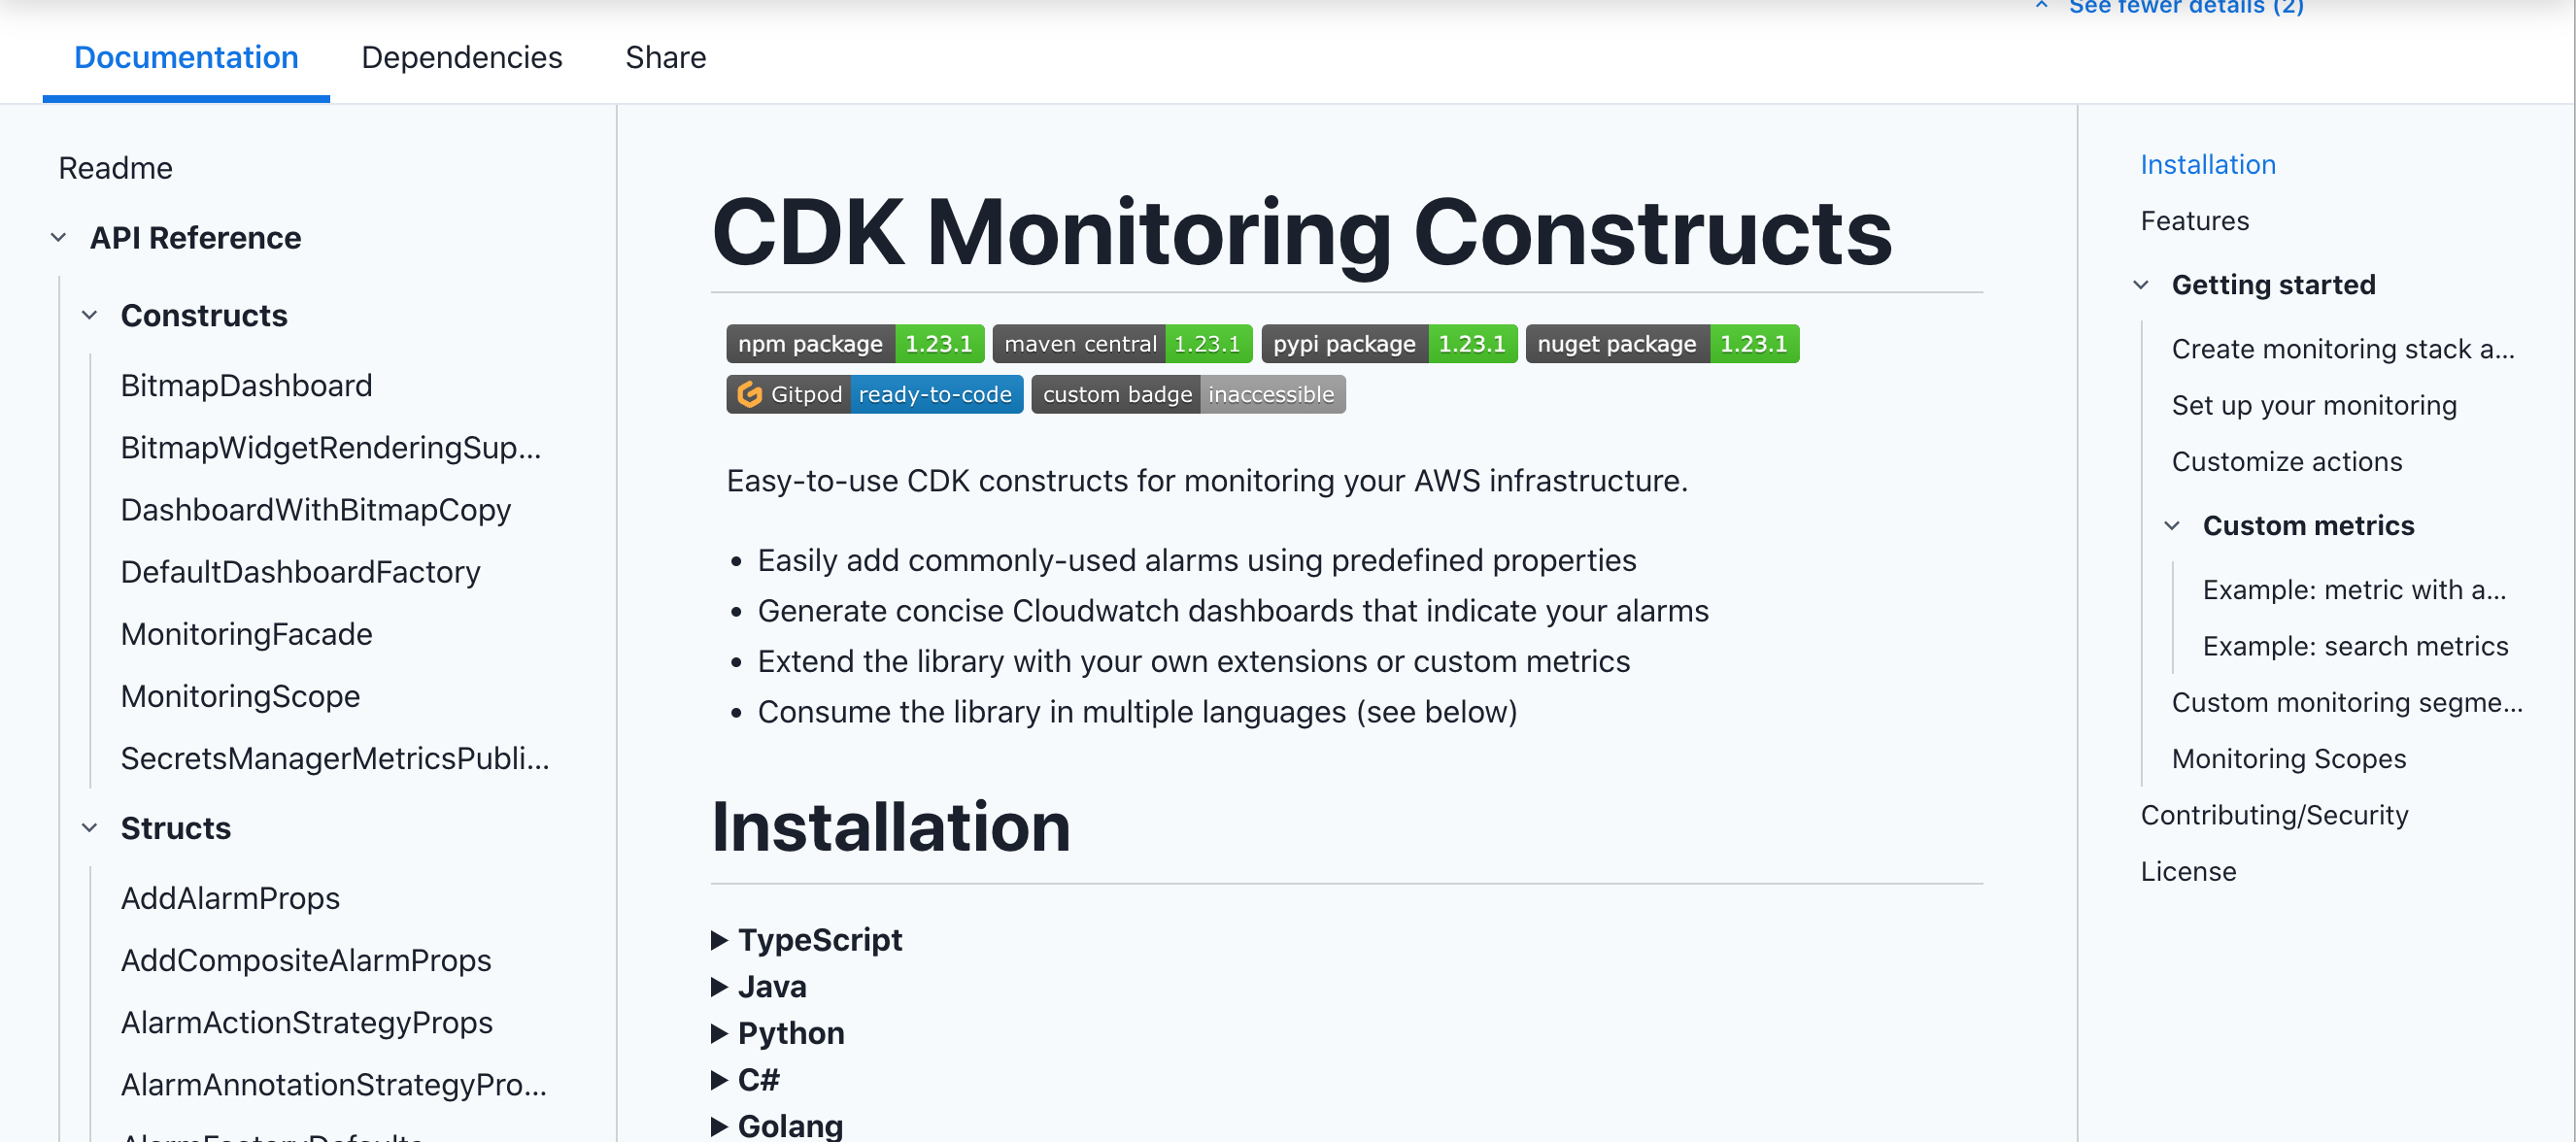
We can click on the entry to get into the documentation, read about installation and how to use this construct library. Good stuff!
This will be the starting point for our work to set up some monitoring for our solution.
9.2 Set up our solution monitoring
9.2.1 Recap of solution setup
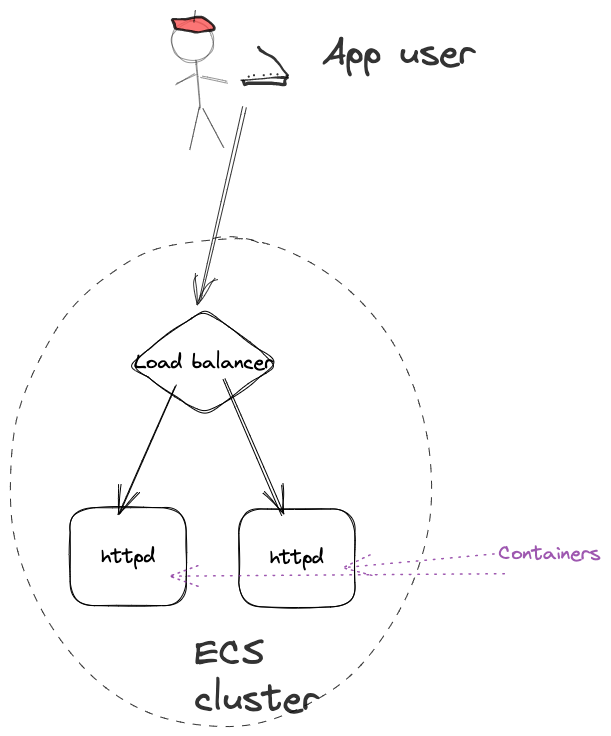
In the previous chapters we have defined an infrastructure running a containerized application in an AWS ECS cluster, behind a load balancer and with auto-scaling set up, to increase or decrease the number of container instances based on various performance characteristics (CPU and memory).
We currently have our infrastructure code divided up into 3 different files:
my-container-infra.py- the main programcontainers.py- support functions for container infrastructurecontainers_test.py- test code for support functions
The current code can be seen here.
9.2.1.1 my-container-infra.py
import os
import aws_cdk as cdk
from aws_cdk import (
    aws_ec2 as ec2,
)
import containers

app = cdk.App()
env = cdk.Environment(
    account=os.getenv("CDK_DEFAULT_ACCOUNT"), region=os.getenv("CDK_DEFAULT_REGION")
)
stack = cdk.Stack(app, "my-container-infra", env=env)

vpcname = app.node.try_get_context("vpcname")
if vpcname:
    vpc = ec2.Vpc.from_lookup(stack, "vpc", vpc_name=vpcname)
else:
    vpc = ec2.Vpc(stack, "vpc", vpc_name="my-vpc", nat_gateways=1, max_azs=2)

cluster = containers.add_cluster(stack, "my-test-cluster", vpc)

taskconfig: containers.TaskConfig = {
    "cpu": 512,
    "memory_limit_mib": 1024,
    "family": "webapp",
}
containerconfig: containers.ContainerConfig = {
    "image": "public.ecr.aws/aws-containers/hello-app-runner:latest",
    "tcp_ports": [8000],
}
taskdef = containers.add_task_definition_with_container(
    stack, f"taskdef-{taskconfig['family']}", taskconfig, containerconfig
)

service = containers.add_service(
    stack, f"service-{taskconfig['family']}", cluster, taskdef, 8000, 2, True
)

containers.set_service_scaling(
    service=service.service,
    config=containers.ServiceScalingConfig(
        min_count=1,
        max_count=4,
        scale_cpu_target=containers.ScalingThreshold(percent=50),
        scale_memory_target=containers.ScalingThreshold(percent=70))
)

app.synth()
9.2.1.2 containers.py
from typing import Literal, TypedDict, List  # noqa
import constructs as cons
from aws_cdk import (
    aws_ec2 as ec2,
    aws_ecs as ecs,
    aws_ecs_patterns as ecspat,
    aws_logs as logs,
)


class TaskConfig(TypedDict):
    cpu: Literal[256, 512, 1024, 2048, 4096]
    memory_limit_mib: int
    family: str


class ContainerConfig(TypedDict):
    image: str
    tcp_ports: List[int]


def add_task_definition_with_container(
    scope: cons.Construct,
    id: str,
    task_config: TaskConfig,
    container_config: ContainerConfig,
) -> ecs.FargateTaskDefinition:
    taskdef = ecs.FargateTaskDefinition(
        scope,
        id,
        cpu=task_config["cpu"],
        memory_limit_mib=task_config["memory_limit_mib"],
        family=task_config["family"],
    )

    logdriver = ecs.LogDrivers.aws_logs(
        stream_prefix=taskdef.family,
        log_retention=logs.RetentionDays.ONE_DAY,
    )
    image = ecs.ContainerImage.from_registry(container_config["image"])
    image_id = f"container-{_extract_image_name(container_config['image'])}"
    containerdef = taskdef.add_container(image_id, image=image, logging=logdriver)

    for port in container_config["tcp_ports"]:
        containerdef.add_port_mappings(ecs.PortMapping(container_port=port, protocol=ecs.Protocol.TCP))

    return taskdef


def add_service(
    scope: cons.Construct,
    id: str,
    cluster: ecs.Cluster,
    taskdef: ecs.FargateTaskDefinition,
    port: int,
    desired_count: int,
    use_public_endpoint: bool = True,
    service_name: str | None = None,
) -> ecspat.ApplicationLoadBalancedFargateService:
    service = ecspat.ApplicationLoadBalancedFargateService(
        scope,
        id,
        cluster=cluster,
        task_definition=taskdef,
        listener_port=port,
        desired_count=desired_count,
        service_name=service_name,
        circuit_breaker=ecs.DeploymentCircuitBreaker(
            rollback=True,
        ),
        public_load_balancer=use_public_endpoint,
    )
    return service


def add_cluster(scope: cons.Construct, id: str, vpc: ec2.IVpc) -> ecs.Cluster:
    return ecs.Cluster(scope, id, vpc=vpc)


def _extract_image_name(image_ref):
    name_with_tag = image_ref.split("/")[-1]
    name = name_with_tag.split(":")[0]
    return name

class ScalingThreshold(TypedDict):
    percent: float

class ServiceScalingConfig(TypedDict):
    min_count: int
    max_count: int
    scale_cpu_target: ScalingThreshold
    scale_memory_target: ScalingThreshold

def set_service_scaling(service: ecs.FargateService, config: ServiceScalingConfig):
    scaling = service.auto_scale_task_count(max_capacity=config["max_count"], min_capacity=config["min_count"])
    scaling.scale_on_cpu_utilization('CpuScaling', target_utilization_percent=config["scale_cpu_target"]["percent"])
    scaling.scale_on_memory_utilization('MemoryScaling', target_utilization_percent=config["scale_memory_target"]["percent"])
9.2.1.3 containers_test.py
import pytest
import aws_cdk as cdk
from aws_cdk import (
    aws_ec2 as ec2,
    aws_ecs as ecs,
    assertions,
)
import containers


def test_ecs_cluster_defined_with_existing_vpc():
    stack = cdk.Stack()
    vpc = ec2.Vpc(stack, "vpc")
    cluster = containers.add_cluster(stack, "my-test-cluster", vpc=vpc)

    template = assertions.Template.from_stack(stack)
    template.resource_count_is("AWS::ECS::Cluster", 1)
    assert cluster.vpc is vpc


def test_ecs_fargate_task_definition_defined():
    stack = cdk.Stack()
    cpuval = 512
    memval = 1024
    familyval = "test"
    taskcfg: containers.TaskConfig = {
        "cpu": cpuval,
        "memory_limit_mib": memval,
        "family": familyval,
    }
    image = "public.ecr.aws/aws-containers/hello-app-runner:latest"
    containercfg: containers.ContainerConfig = {"image": image, "tcp_ports": [8000]}
    taskdef = containers.add_task_definition_with_container(
        stack, f"taskdef-{taskcfg['family']}", taskcfg, containercfg
    )

    assert taskdef.is_fargate_compatible
    assert taskdef in stack.node.children

    template = assertions.Template.from_stack(stack)
    template.resource_count_is("AWS::ECS::TaskDefinition", 1)
    template.has_resource_properties(
        "AWS::ECS::TaskDefinition",
        {
            "RequiresCompatibilities": ["FARGATE"],
            "Cpu": str(cpuval),
            "Memory": str(memval),
            "Family": familyval,
        },
    )


def test_container_definition_added_to_task_definition():
    stack = cdk.Stack()
    cpuval = 512
    memval = 1024
    familyval = "test"
    taskcfg: containers.TaskConfig = {
        "cpu": cpuval,
        "memory_limit_mib": memval,
        "family": familyval,
    }
    image_name = "public.ecr.aws/aws-containers/hello-app-runner:latest"
    containercfg: containers.ContainerConfig = {"image": image_name, "tcp_ports": [8000]}

    taskdef = containers.add_task_definition_with_container(
        stack, "test-taskdef", taskcfg, containercfg
    )

    template = assertions.Template.from_stack(stack)
    containerdef: ecs.ContainerDefinition = taskdef.default_container  # type: ignore

    assert containerdef is not None
    assert containerdef.image_name == image_name

    template.has_resource_properties(
        "AWS::ECS::TaskDefinition",
        {
            "ContainerDefinitions": assertions.Match.array_with(
                [assertions.Match.object_like({"Image": image_name})]
            )
        },
    )

@pytest.fixture
def service_test_input_data():
    stack = cdk.Stack()
    vpc = ec2.Vpc(stack, "vpc")
    cluster = containers.add_cluster(stack, "test-cluster", vpc=vpc)
    cpuval = 512
    memval = 1024
    familyval = 'test'
    taskcfg: containers.TaskConfig = {
        "cpu": cpuval,
        "memory_limit_mib": memval,
        "family": familyval,
    }
    image_name = "public.ecr.aws/aws-containers/hello-app-runner:latest"
    containercfg: containers.ContainerConfig = {"image": image_name, "tcp_ports": [8000]}

    taskdef = containers.add_task_definition_with_container(
        stack, "test-taskdef", taskcfg, containercfg
    )
    return { "stack": stack, "cluster": cluster, "task_definition": taskdef}


def test_fargate_service_created_with_only_mandatory_properties(service_test_input_data):
    stack = service_test_input_data["stack"]
    cluster = service_test_input_data["cluster"]
    taskdef = service_test_input_data["task_definition"]

    port = 80
    desired_count = 1

    service = containers.add_service(
        stack, "test-service", cluster, taskdef, port, desired_count
    )

    sg_capture = assertions.Capture()
    template = assertions.Template.from_stack(stack)

    assert service.cluster == cluster
    assert service.task_definition == taskdef

    template.resource_count_is("AWS::ECS::Service", 1)
    template.has_resource_properties(
        "AWS::ECS::Service",
        {
            "DesiredCount": desired_count,
            "LaunchType": "FARGATE",
            "NetworkConfiguration": assertions.Match.object_like(
                {
                    "AwsvpcConfiguration": assertions.Match.object_like(
                        {
                            "AssignPublicIp": "DISABLED",
                            "SecurityGroups": assertions.Match.array_with([sg_capture]),
                        }
                    )
                }
            ),
        },
    )

    template.resource_count_is('AWS::ElasticLoadBalancingV2::LoadBalancer', 1)
    template.has_resource_properties('AWS::ElasticLoadBalancingV2::LoadBalancer', {
        'Type': 'application',
        'Scheme': 'internet-facing'
    })

    template.has_resource_properties(
        "AWS::EC2::SecurityGroup",
        {
            "SecurityGroupIngress": assertions.Match.array_with(
                [
                    assertions.Match.object_like(
                        {"CidrIp": "0.0.0.0/0", "FromPort": port, "IpProtocol": "tcp"}
                    )
                ]
            )
        },
    )

def test_fargate_service_created_without_public_access(service_test_input_data):
    stack = service_test_input_data["stack"]
    cluster = service_test_input_data["cluster"]
    taskdef = service_test_input_data["task_definition"]

    port = 80
    desired_count = 1
    containers.add_service(stack, 'test-service', cluster, taskdef, port, desired_count, False)

    template = assertions.Template.from_stack(stack)
    template.resource_count_is('AWS::ElasticLoadBalancingV2::LoadBalancer', 1)
    template.has_resource_properties('AWS::ElasticLoadBalancingV2::LoadBalancer', {
        'Type': 'application',
        'Scheme': 'internal'
    })

def test_scaling_settings_for_service(service_test_input_data):
    stack = service_test_input_data['stack']
    cluster = service_test_input_data['cluster']
    taskdef = service_test_input_data['task_definition']
    port = 80
    desired_count = 2

    service = containers.add_service(stack, 'test-service', cluster, taskdef, port, desired_count, False)

    config = containers.ServiceScalingConfig(
        min_count=1,
        max_count=5,
        scale_cpu_target=containers.ScalingThreshold(percent=50),
        scale_memory_target=containers.ScalingThreshold(percent=50))
    containers.set_service_scaling(service=service.service, config=config)

    scale_resource = assertions.Capture()
    template = assertions.Template.from_stack(stack)
    template.resource_count_is('AWS::ApplicationAutoScaling::ScalableTarget', 1)
    template.has_resource_properties('AWS::ApplicationAutoScaling::ScalableTarget', {
        'MaxCapacity': config["max_count"],
        'MinCapacity': config["min_count"],
        'ResourceId': scale_resource,
        'ScalableDimension': 'ecs:service:DesiredCount',
        'ServiceNamespace': 'ecs'
    })

    template.resource_count_is('AWS::ApplicationAutoScaling::ScalingPolicy', 2)
    template.has_resource_properties('AWS::ApplicationAutoScaling::ScalingPolicy', {
        'PolicyType': 'TargetTrackingScaling',
        'TargetTrackingScalingPolicyConfiguration': assertions.Match.object_like({
            'PredefinedMetricSpecification': assertions.Match.object_equals({
                'PredefinedMetricType': 'ECSServiceAverageCPUUtilization'
            }),
            'TargetValue': config["scale_cpu_target"]["percent"]
        })
    })
    template.has_resource_properties('AWS::ApplicationAutoScaling::ScalingPolicy', {
        'PolicyType': 'TargetTrackingScaling',
        'TargetTrackingScalingPolicyConfiguration': assertions.Match.object_like({
            'PredefinedMetricSpecification': assertions.Match.object_equals({
                'PredefinedMetricType': 'ECSServiceAverageMemoryUtilization'
            }),
            'TargetValue': config["scale_memory_target"]["percent"]
        })
    })
9.2.2 Where to start with the monitoring?
So where do we start? We have found a monitoring library for AWS CDK that may make our lives easier perhaps, but we do not know that much about it yet.
If we have some monitoring, we want to see how our solution is doing, based on some kind of metrics, and we may want alerts when things may go bad. It would be good with some visualisation of this.
You may already have some corporate solution you want to hook up your monitoring to, but for this article series, we are just going to stick within the AWS services. One option available to us in this case is to set up monitoring dashboards in CloudWatch.
Thus, our infrastructure code should set up a dashboard at least, and then we have to sort out what we may want to put on that dashboard and how.
Let us explore that! We will start by writing a test.
9.2.3 Add monitoring foundation
Our initial idea here is that if we should add monitoring to our solution, we should also have at least one dashboard that can visualize information for us. We may change our minds later about this, but it is a starting point.
For this purpose, we will create a file to include tests for our monitoring - monitoring_test.py. We add a test for a function called init_monitoring, which we can apply to our stack, and provide a configuration input. This should return data or handle that we can use for handling the monitoring we want to add. At the very least, we should have an empty CloudWatch dashboard set up. It seems appropriate to include the dashboard name then in the config.
How do we know if we will have a dashboard? The documentation for cdk-monitoring-constructs is not entirely clear from initial view, but it seems it may add a dashboard implicitly. If we look at the CloudFormation documentation, we also see that there is an AWS::CloudWatch::Dashboard resource.
So our test can make a call to an init_monitoring function and this should cause that a CloudWatch dashboard being added to the generated CloudFormation. Let us also now initially log what the generated CloudFormation will look like to see what we actually get.
import pytest
import aws_cdk as cdk
from aws_cdk import assertions
import monitoring as mon


def test_init_monitoring_of_stack_with_defaults():
    stack = cdk.Stack()

    config = mon.MonitoringConfig(dashboard_name="test-monitoring")
    mon.init_monitoring(stack, config)
    template = assertions.Template.from_stack(stack)
    print(template)
    template.resource_count_is("AWS::CloudWatch::Dashboard", 1)
    template.has_resource_properties(
        "AWS::CloudWatch::Dashboard", {"DashboardName": config["dashboard_name"]}
    )
For implementing init_monitoring, we can try to use the MonitoringFacade from cdk-monitoring-constructs. The function can simply return a structure which includes the MonitoringFacade object, which seems suitable for our purposes.
from typing import TypedDict
from constructs import Construct
import aws_cdk as cdk
import cdk_monitoring_constructs as cdkmon


class MonitoringConfig(TypedDict):
    dashboard_name: str


class MonitoringContext(TypedDict):
    handler: cdkmon.MonitoringFacade


def init_monitoring(scope: Construct, config: MonitoringConfig) -> MonitoringContext:
    return MonitoringContext(
        handler=cdkmon.MonitoringFacade(scope, config["dashboard_name"])
    )
Running the test now when the code compiles, we can see both from our test and the log output, that our guess was correct, there will be a dashboard created when we create the MonitoringFacade!
We can add a call in our main program also to initialize the monitoring. The docs for the monitoring library also show that we can add header info to the dashboard, so we can include that as well.
monitoring_config = monitoring.MonitoringConfig(dashboard_name="monitoring")
mon = monitoring.init_monitoring(stack, config=monitoring_config)
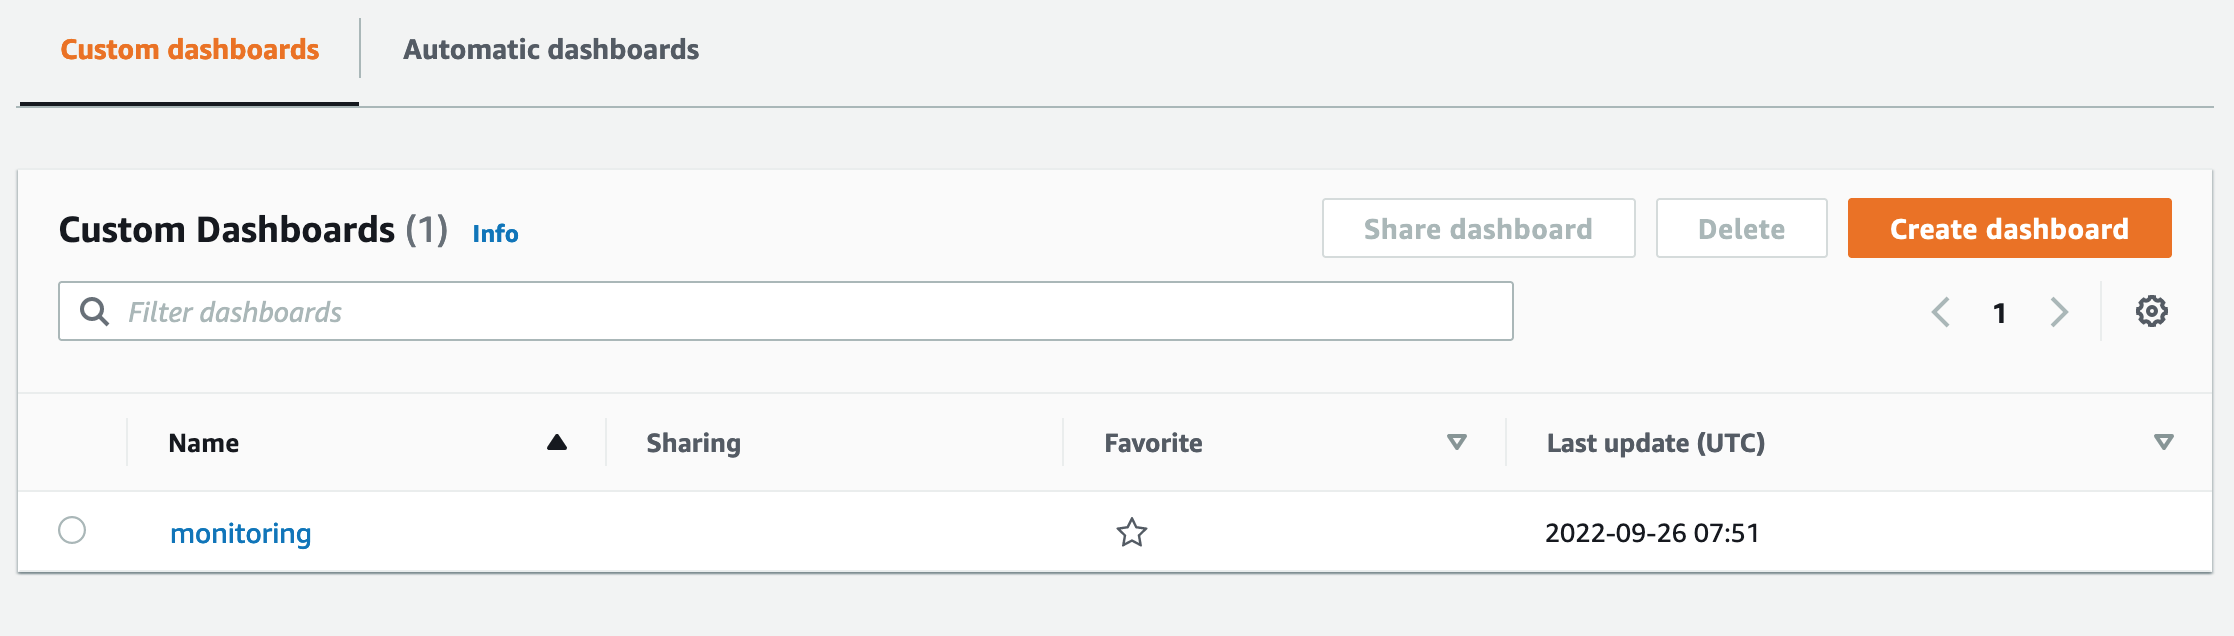
mon["handler"].add_medium_header("Test App monitoring")You can deploy the updated AWS CDK code if you want and verify that there will be an actual dashboard created. It would not contain anything, though.
9.2.4 Add monitoring of actual resources
Our next step is to add some actual monitoring of resources. We can look at what cdk-monitoring-constructs provides for us. From the documentation, we can see that are many functions available from the MonitoringFacade, that start with monitor in the name and refer to different resources.
Since our solution sets up a Fargate Service in an ECS cluster with an application load balancer in front of the containers we run, the functions monitor_fargate_application_load_balancer and monitor_fargate_service seems relevant in this case. There is also a more generic monitor_scope, which could also apply. Reading the somewhat sparse docs a bit more, monitor_fargate_service may be more appropriate if you use the AWS CDK ApplicationLoadBalancedFargateService, which is what we use in our solution.
So let us add monitoring using this function! There is only one required property for configuring monitoring, which is the ApplicationLoadBalancedFargateService object we have created. An optional field we may want to add also is the human_readable_name property as well.
After we add this call to our code, we can deploy the solution and see what we get.
service = containers.add_service(
    stack, f"service-{taskconfig['family']}", cluster, taskdef, 8000, 2, True
)

containers.set_service_scaling(
    service=service.service,
    config=containers.ServiceScalingConfig(
        min_count=1,
        max_count=4,
        scale_cpu_target=containers.ScalingThreshold(percent=50),
        scale_memory_target=containers.ScalingThreshold(percent=70),
    ),
)

monitoring_config = monitoring.MonitoringConfig(dashboard_name="monitoring")
mon = monitoring.init_monitoring(stack, config=monitoring_config)

mon["handler"].add_medium_header("Test App monitoring")
mon["handler"].monitor_fargate_service(
    fargate_service=service,
    human_readable_name="My test service",
)
After deployment, we can check out in CloudWatch to see what has been added.
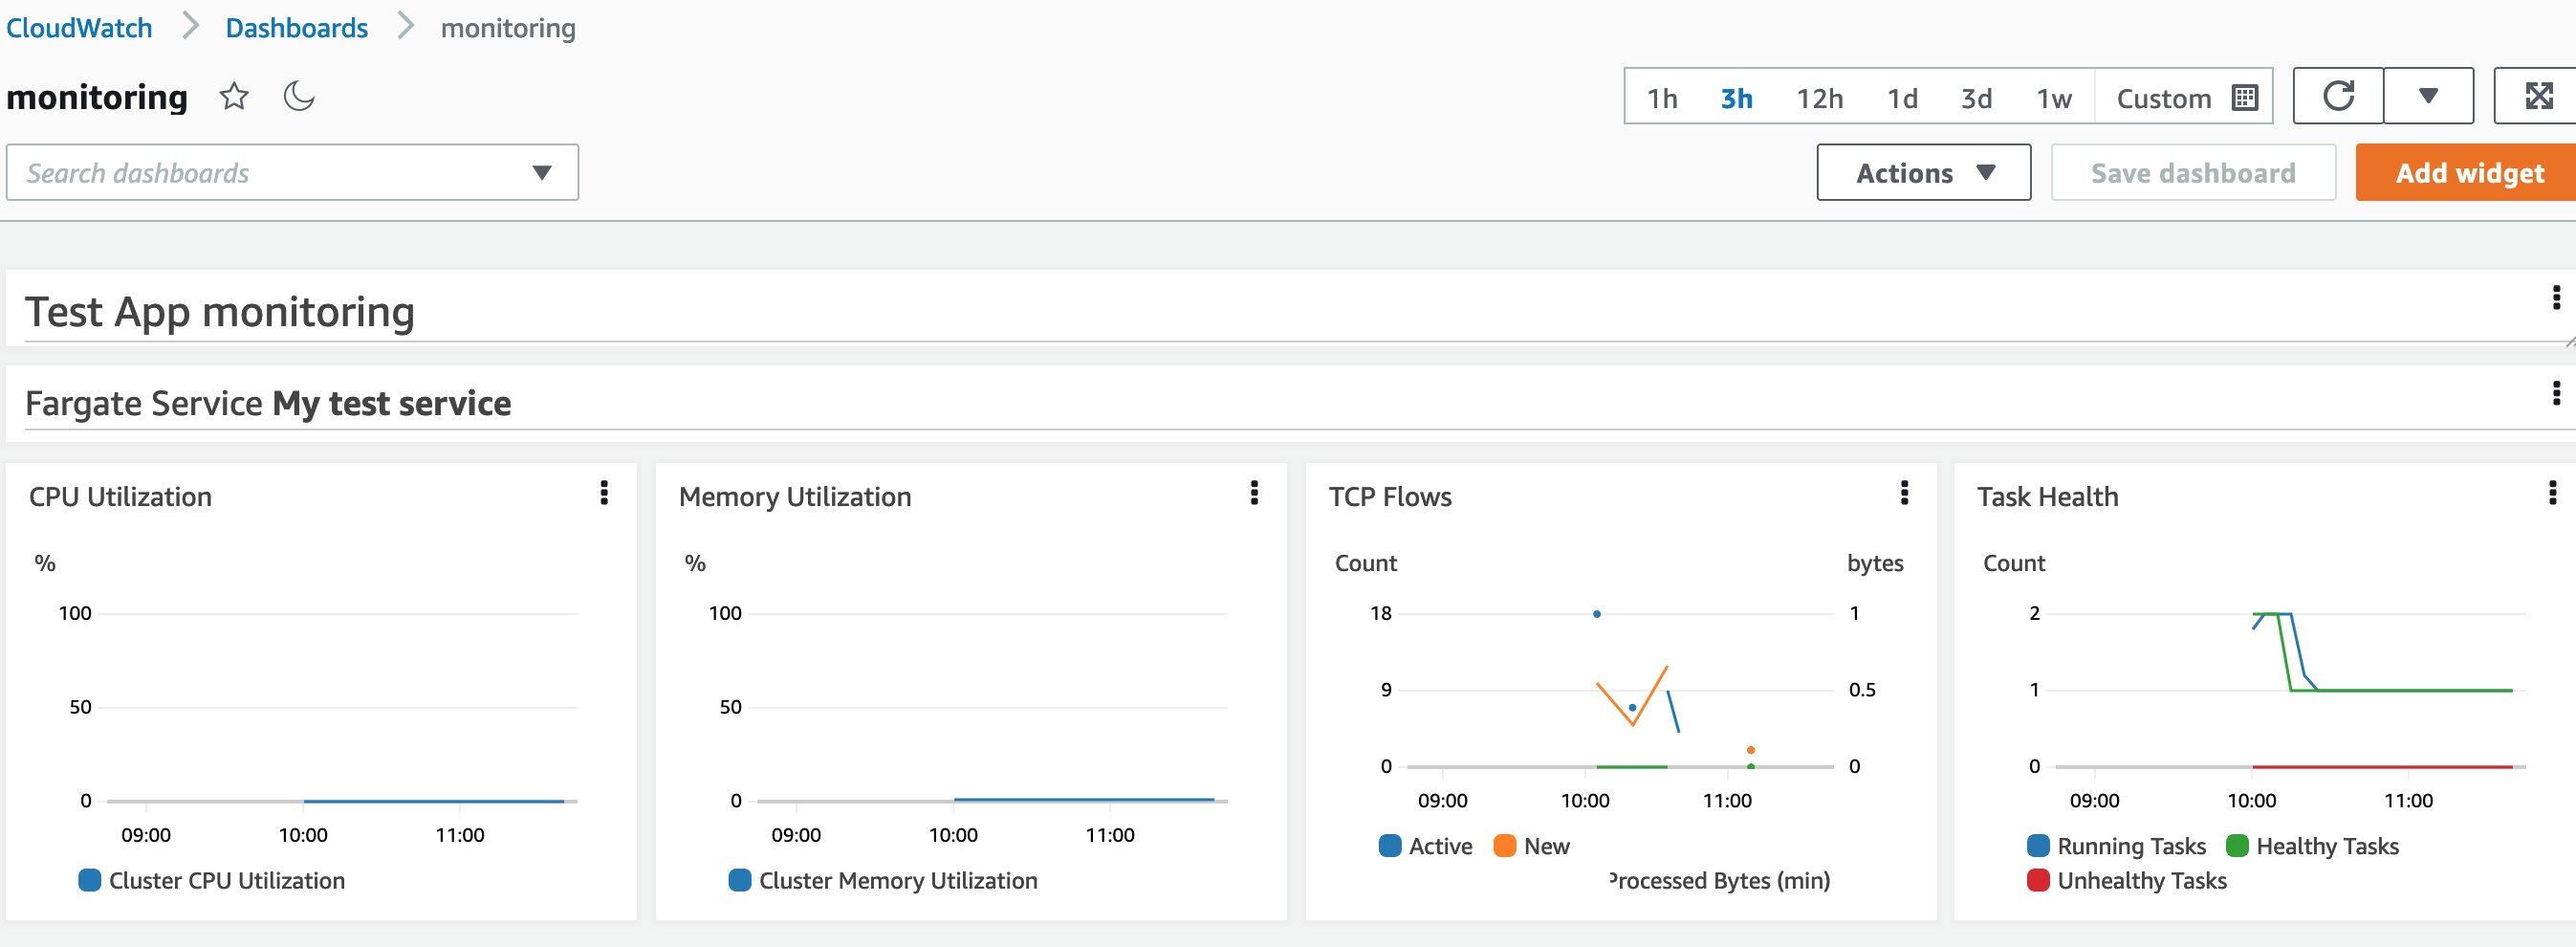
We have a few widgets here for CPU and memory, TCP traffic and task health. That is a good start! The task health view actually shows a property of our configuration. We have set the desired task count for our service to 2, but we have also set up our auto-scaling to have a minimum task count of 1 and a maximum of 4. So the service initially started with 2 tasks running and then scaled down to a single task.
Note: I also tried to use the monitor_fargate_application_load_balancer function, and the result was the same dashboard. The difference was the parameters that you were required to provide in the call.
9.2.5 Setting up alarms - what do we need?
Now that we have some visuals in dashboard for our monitoring, let us try to set up some kind of alarm as well. For easy testing, let us set some alarm on the number of tasks running in our solution.
Reading the docs for cdk-monitoring-constructs, there is an option for us to add an alarm for running task count, e.g. if the number of running tasks go below a certain threshold for some time.
Reading through the docs, one can see that for this type of alarm to work, we need to enable container insights on the ECS Cluster. By default, this is disabled. The aws-ecs Cluster construct in AWS CDK allows us to set this properly, but does not allow us to check the state on the created cluster. This means that in order to test this, we need to check the generated CloudFormation.
Also, if we set an alarm, we need to send a notification about the alarm somewhere. One common approach is to send notifications on an SNS topic. Thus, we need to make sure we have an SNS topic that alarms will go to.
So we have 3 things to develop here that we can immediately think of:
The running task alarm itself
The SNS topic to send alarms to
Enabling container insights on the ECS Cluster
Container insights should be in place before the alarm itself, so let us start there. The SNS topic does not have to be in place before the alarm, since notification is optional and SNS is not the only way to send notifications.
9.2.6 Enabling container insights
Let us start by adding a new test for creating an ECS cluster. Right now we have the add_cluster function, which we pass in a construct scope, and id and a VPC. If we are going to pass in more properties to this function, we can add more function parameters. We can also use the same pattern as CDK constructs and pass in a set of properties as a single parameter.
I like the latter better, because it becomes more clear what each input is with named properties.
So let us refactor the current add_cluster function to pass in a set of properties as a single parameter, and then add a new property to enable container insights.
class ClusterConfig(TypedDict):
    vpc: ec2.IVpc
    enable_container_insights: NotRequired[bool]

def add_cluster(scope: cons.Construct, id: str, config: ClusterConfig) -> ecs.Cluster:
    return ecs.Cluster(scope, id, vpc=config["vpc"], container_insights=config.get("enable_container_insights", None))
In our new test to check the container insights checking, we test the generated CloudFormation for the setting.
def test_check_that_container_insights_become_enabled():
    stack = cdk.Stack()
    vpc = ec2.Vpc(stack, "vpc")
    config = containers.ClusterConfig(vpc=vpc, enable_container_insights=True)
    containers.add_cluster(stack, "test-cluster", config)

    template = assertions.Template.from_stack(stack)

    template.has_resource_properties('AWS::ECS::Cluster', {
        'ClusterSettings': assertions.Match.array_with(
            pattern=[
                assertions.Match.object_equals(pattern={
                    'Name': 'containerInsights',
                    'Value': 'enabled'
                })
            ]
        )
    })
We can re-deploy the cluster with the new setting if we want.
9.2.7 Adding an alarm
Next step is to add an alarm. Here, the logic lives with the cdk-monitoring-constructs library itself. So there is not much point in making sure the alarm is there, if we are just using the functions in the library itself.
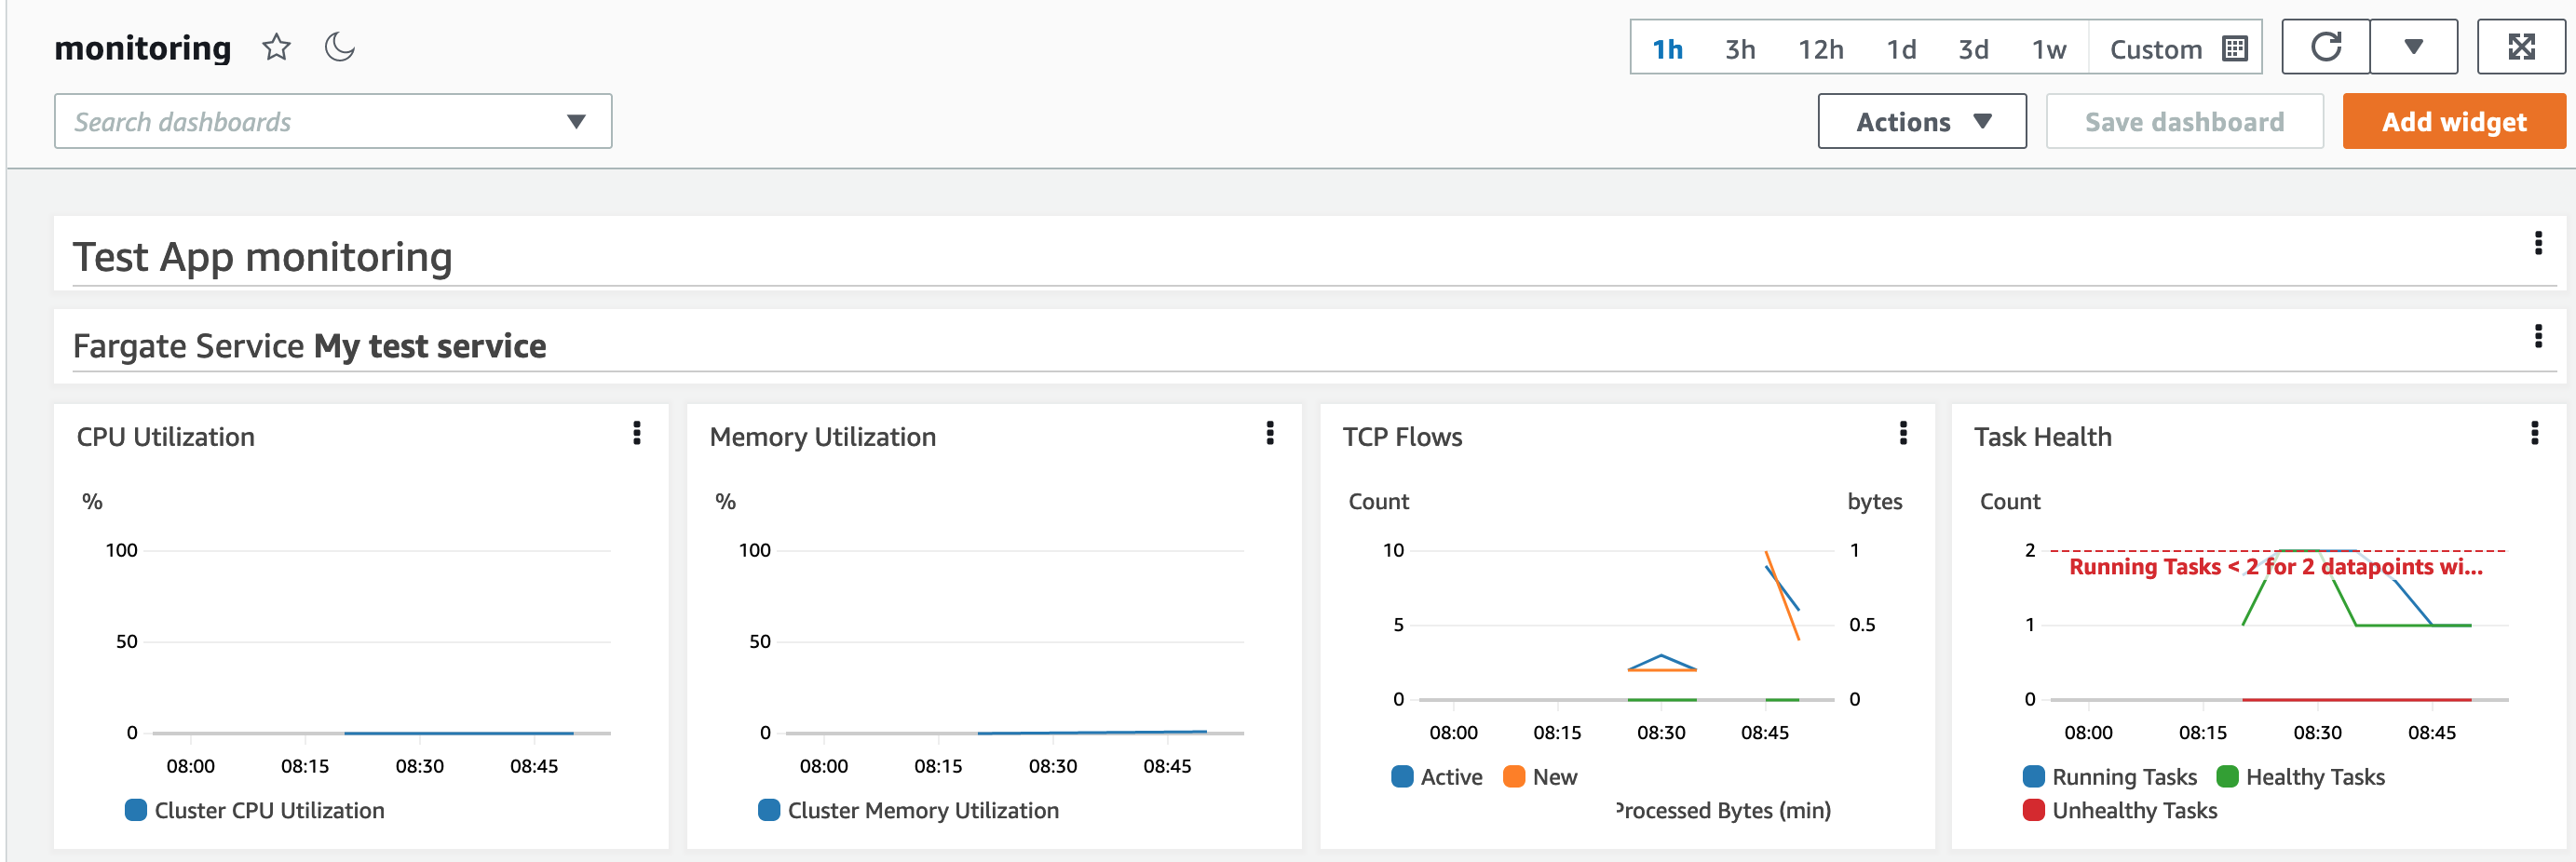
The alarm to set up for testing this feature will be to trigger an alarm if the number of running tasks is less than 2 for 10 minutes or more.
The alarm configuration will use 5-minute periods and trigger an alarm if 2 evaluation periods have passed and 2 data points fulfill the condition for the alarm. Why not just a single 10-minute period? The reason here is that sometimes data may be delayed or simply missing in CloudWatch. To avoid false positives, we set the evaluation to include multiple periods and data points.
We can provide alarm information in our call to monitor_fargate_service, which we set up for an alarm if the number of tasks go below 2. We know this will happen since our minimal task count in the auto-scaling is set to 1.
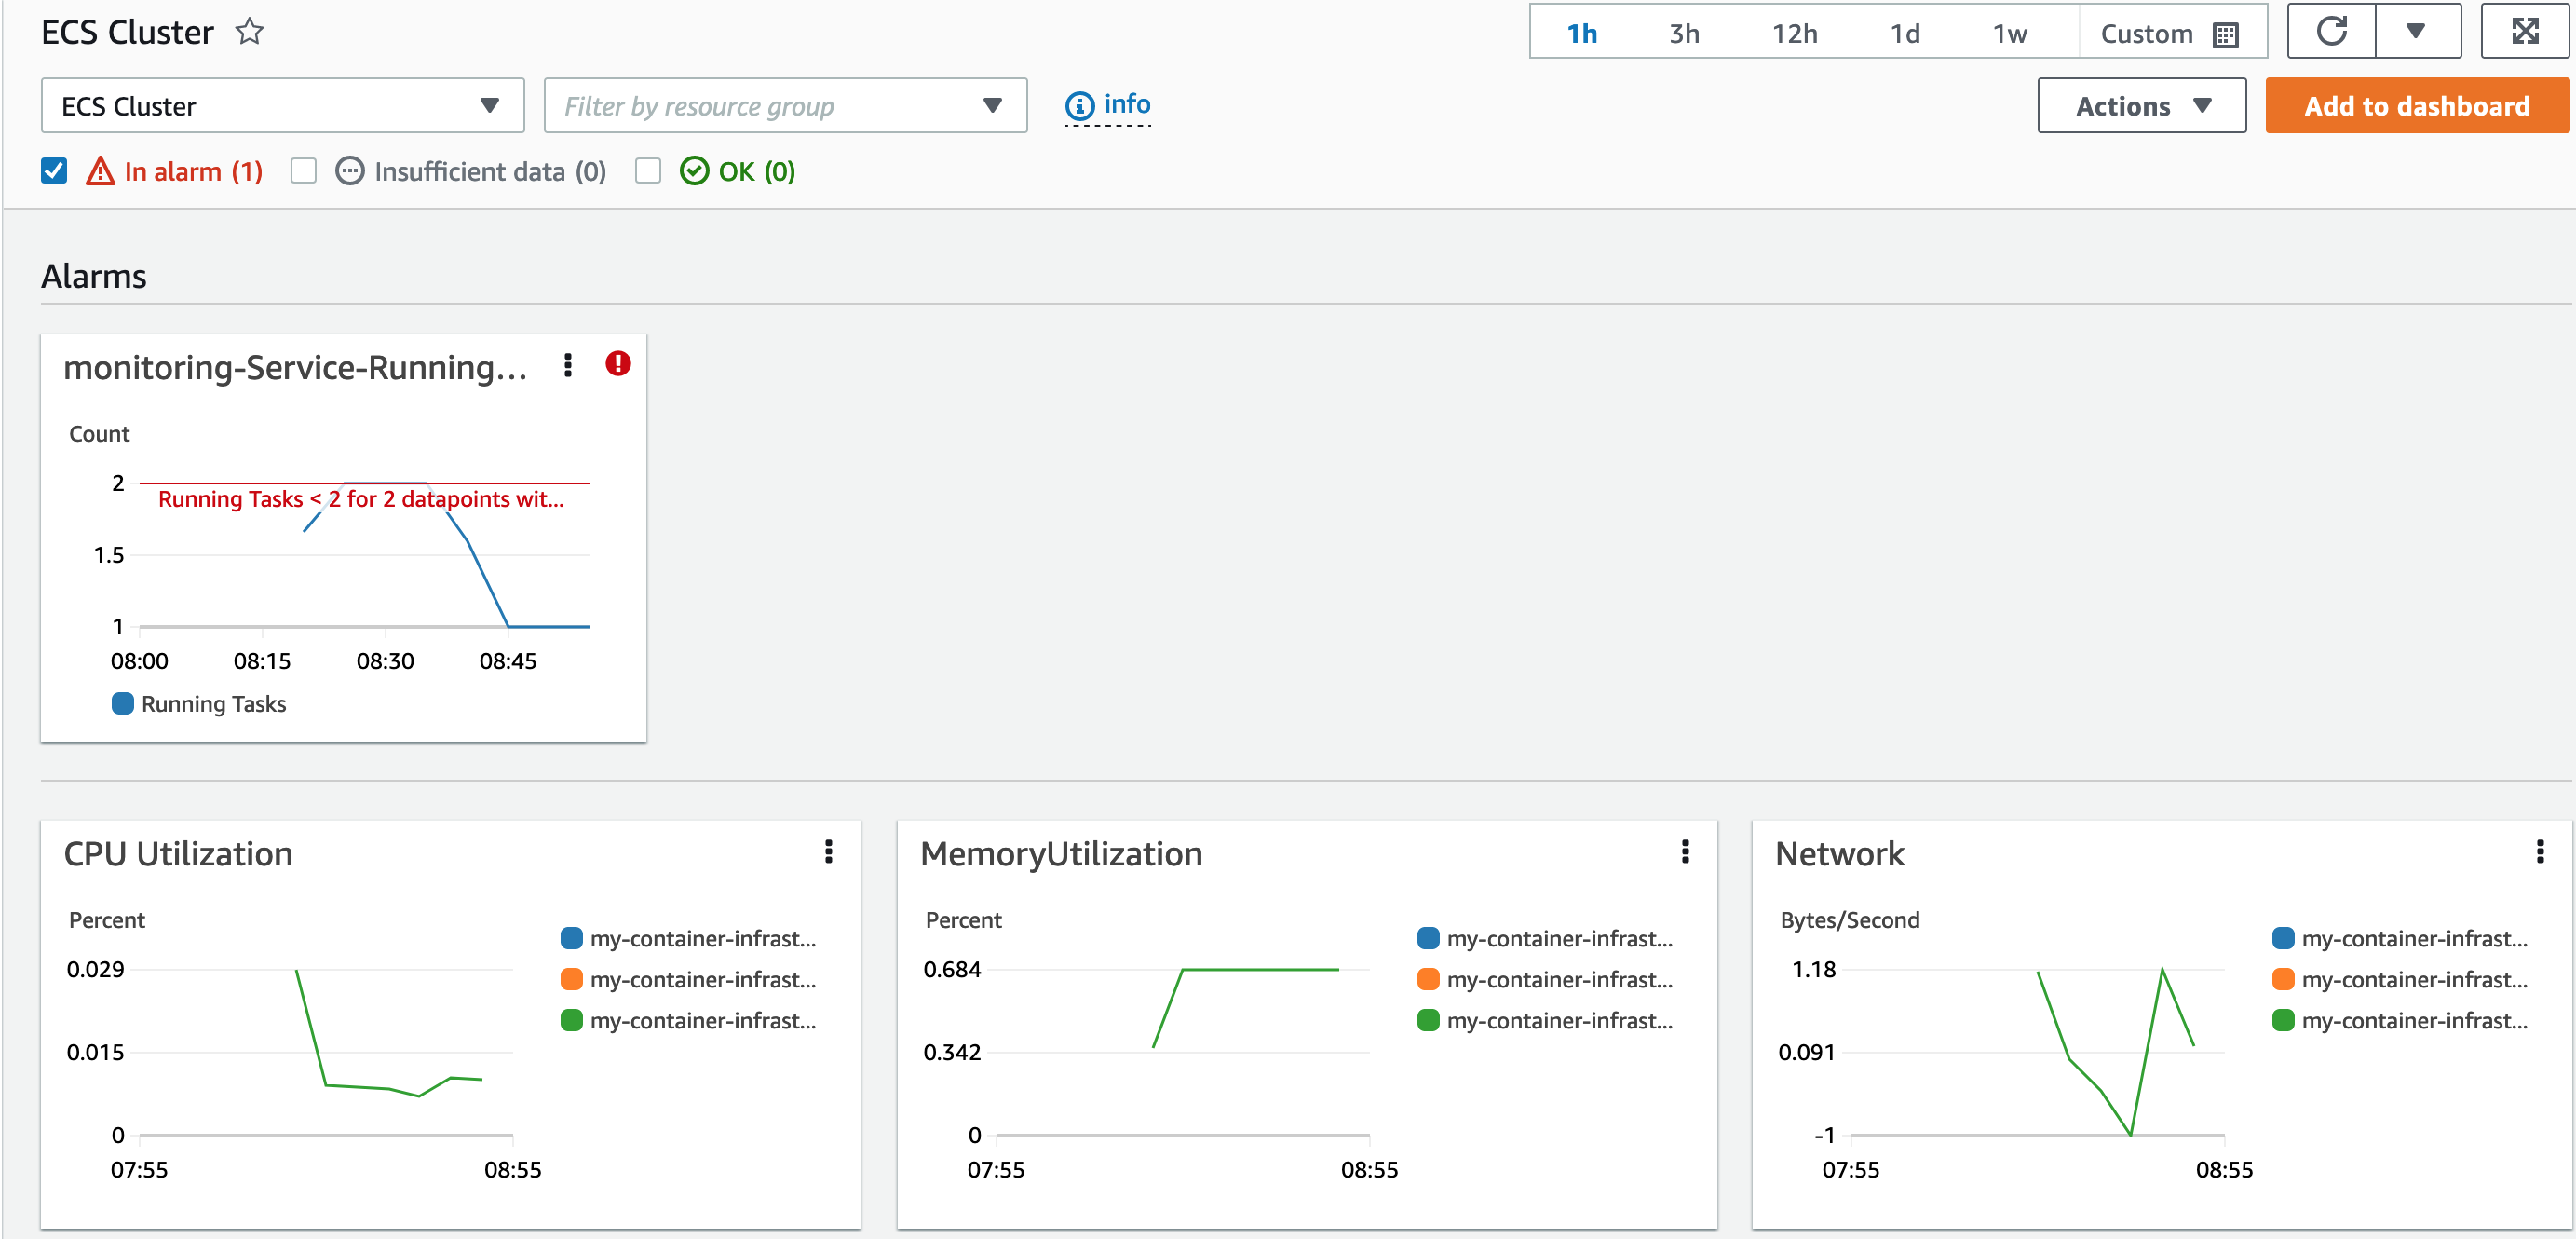
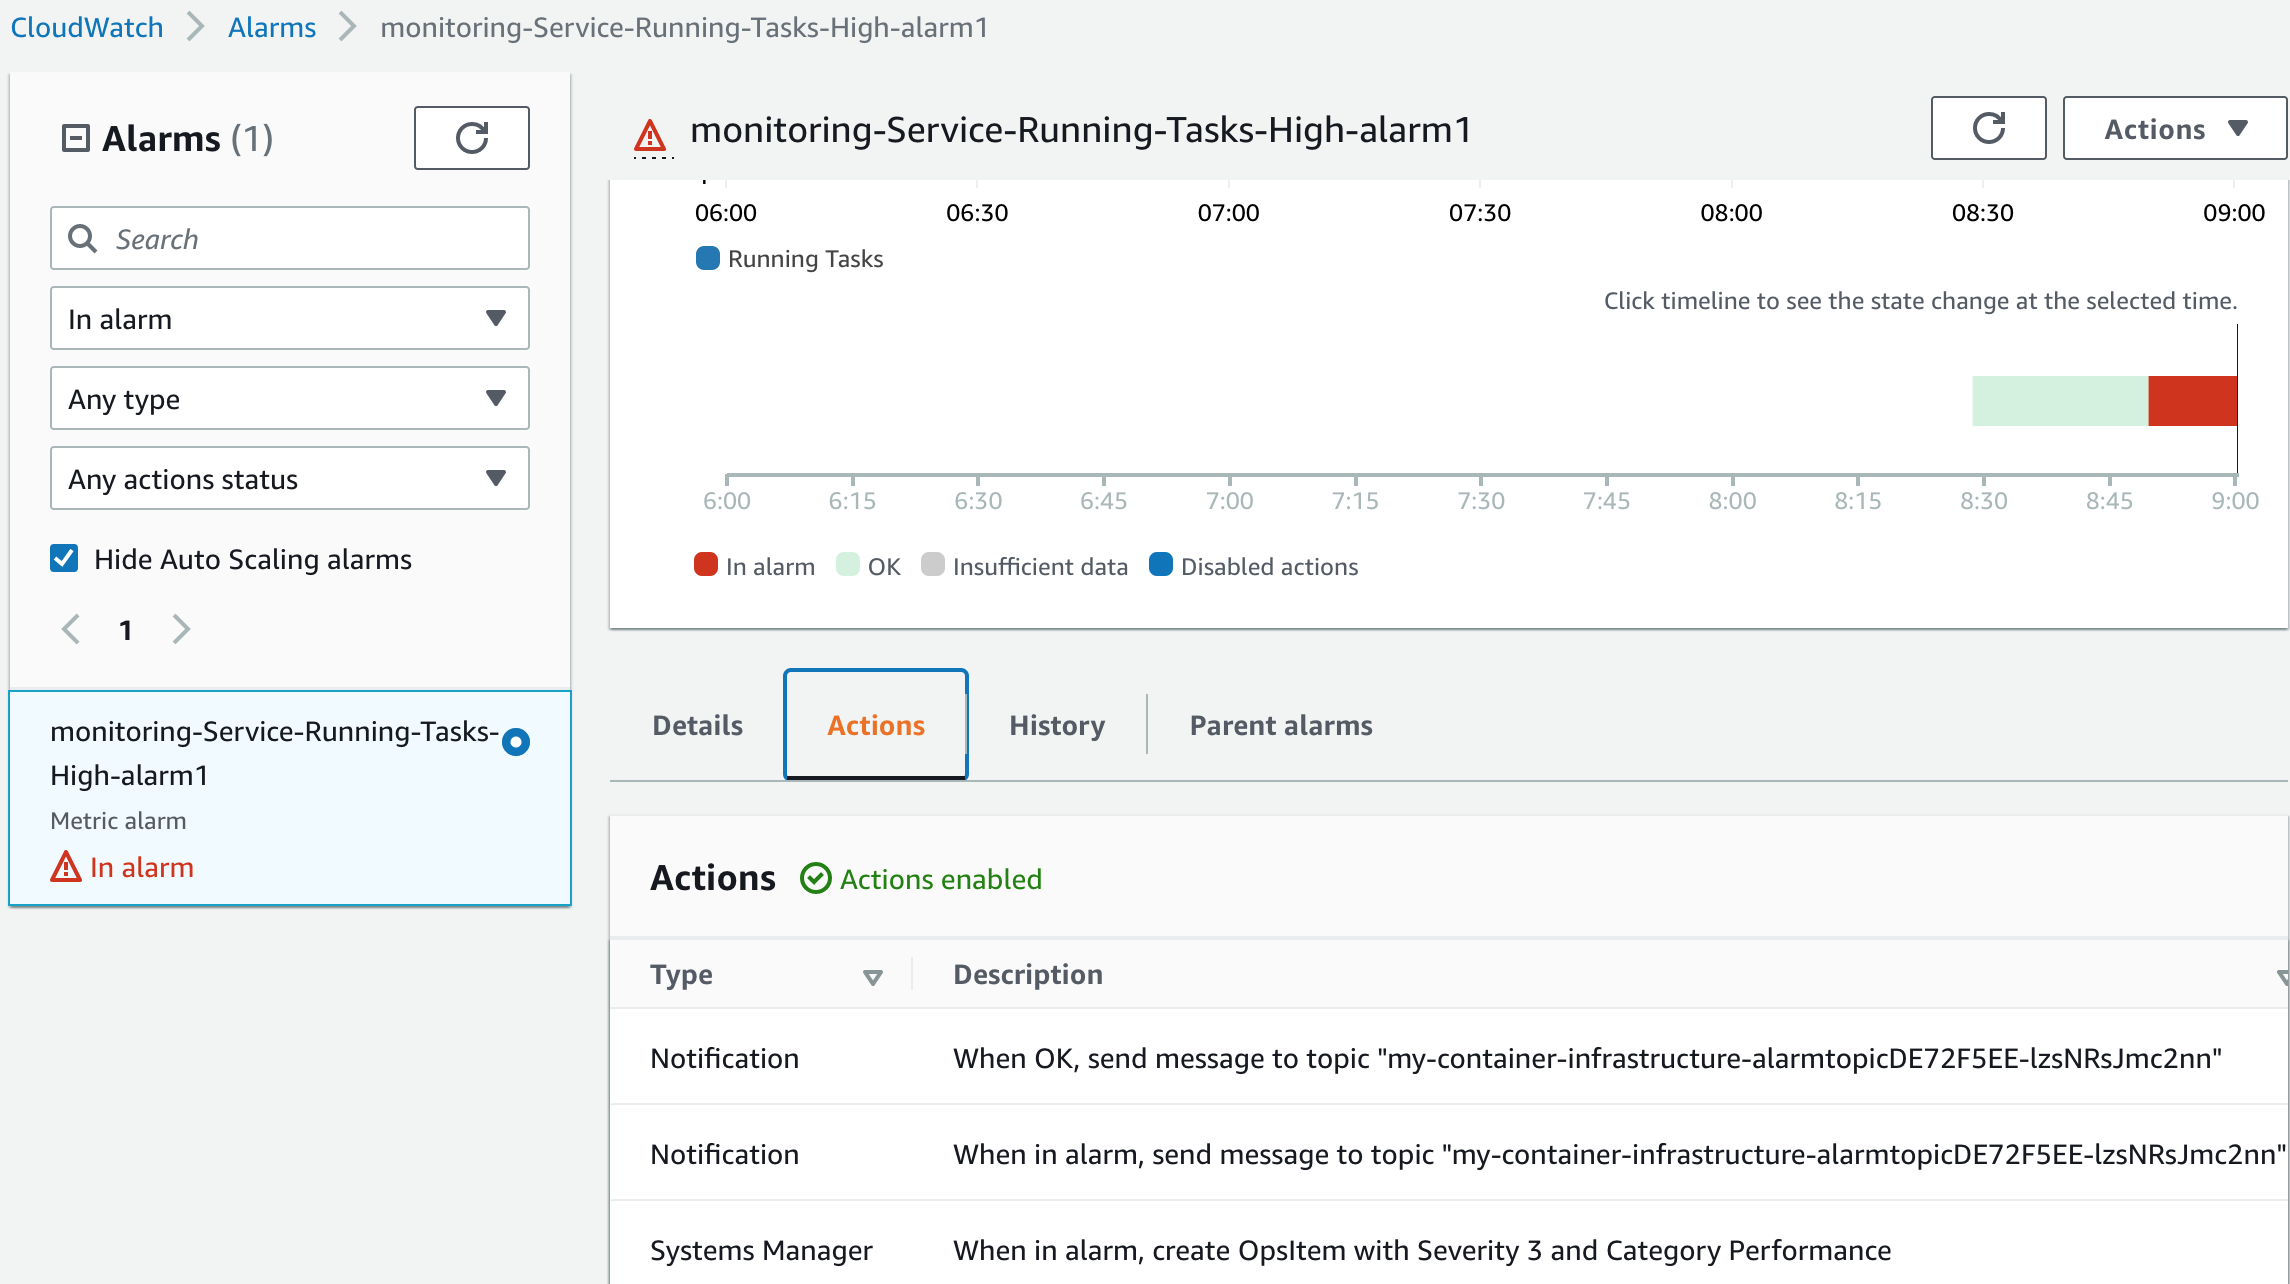
We add the alarm to our code and redeploy to see what the effect is on our monitoring deployment. The dashboard has an update, and there is a new alarm in place. We can see that the alarm has no action associated with it.
mon["handler"].add_medium_header("Test App monitoring")
mon["handler"].monitor_fargate_service(
    fargate_service=service,
    human_readable_name="My test service",
)

mon["handler"].monitor_fargate_service(
    fargate_service=service,
    human_readable_name='My test service',
    add_running_task_count_alarm={
        'alarm1': cdkmon.RunningTaskCountThreshold(
            max_running_tasks=2,
            comparison_operator_override=cw.ComparisonOperator.LESS_THAN_THRESHOLD,
            evaluation_periods=2,
            datapoints_to_alarm=2,
            period=cdk.Duration.minutes(5),
        )
    })
Thus, the next step for us is to associate the alarm with an SNS topic.
9.2.8 Add an alarm notification topic
Our next consideration is how this SNS topic should be added, and how to test that.
We can add an alarm action for each alarm we define, which includes an SNS topic. However, it may be cumbersome to add this for every single alarm we define - especially if we decide to use the same topic for all or most alarms.
Fortunately, cdk-monitoring-constructs allows us to define a default action for alarms, when we create the MonitoringFacade. In that way, we can define the topic once only, and in one place.
Let us add an optional property to the configuration passed to init_monitoring, which is an SNS topic construct, and set that up as the default action. We can refactor this function to include a topic that will be set as a default action.
But how do we test this? Unfortunately, there is not any easy test, since we cannot directly extract that information from the created MonitoringFacade object. We essentially would need to create an alarm on some resource that we also created and then examine the created alarm if it has an action which includes the default SNS topic we have set. To do this, we would also need to examine the generated CloudFormation to see the details there.
Technically, we can certainly build such a test to check that this is generated properly. But then we also would mainly test the cdk-monitoring-constructs library, and not that much of our own code. That is wasteful. And possibly also brittle, since we cannot be 100% sure that our test code would work if the underlying implementation changed.
So we will relax on the test coverage here a bit for now.
def test_init_monitoring_of_stack_with_sns_alarm_topic():
    stack = cdk.Stack()
    ec2.Vpc(stack, 'vpc')
    alarm_topic = sns.Topic(stack, 'alarm-topic')

    monitoring_config = mon.MonitoringConfig(
        dashboard_name='test-monitoring',
        default_alarm_topic=alarm_topic
    )

    monitoring = mon.init_monitoring(stack, config=monitoring_config)
    assert(monitoring.get("default_alarm_topic") == monitoring_config.get("default_alarm_topic"))
    assert(monitoring.get("default_alarm_name_prefix") == monitoring_config.get("dashboard_name"))
9.2.9 Add an alarm notification
We can deploy the infrastructure updates and see that we have alarm information in place as well now, which has an action to send to our SNS topic.
alarm_topic = sns.Topic(stack, 'alarm-topic', display_name='Alarm topic')

monitoring_config = monitoring.MonitoringConfig(dashboard_name='monitoring', default_alarm_topic=alarm_topic)
mon = monitoring.init_monitoring(stack, monitoring_config)
If you want to check that the notification is sent via SNS, you can add an email subscriber to the topic and check that way.
alarm_email = 'hello@example.com'
alarm_topic.add_subscription(snssubs.EmailSubscription(alarm_email))
9.2.10 Alarm severity and category
When we send the alarm to SNS, we have nothing right now to show the severity of the alarm, nor any categorization of the alarm beside the name of the alarm.
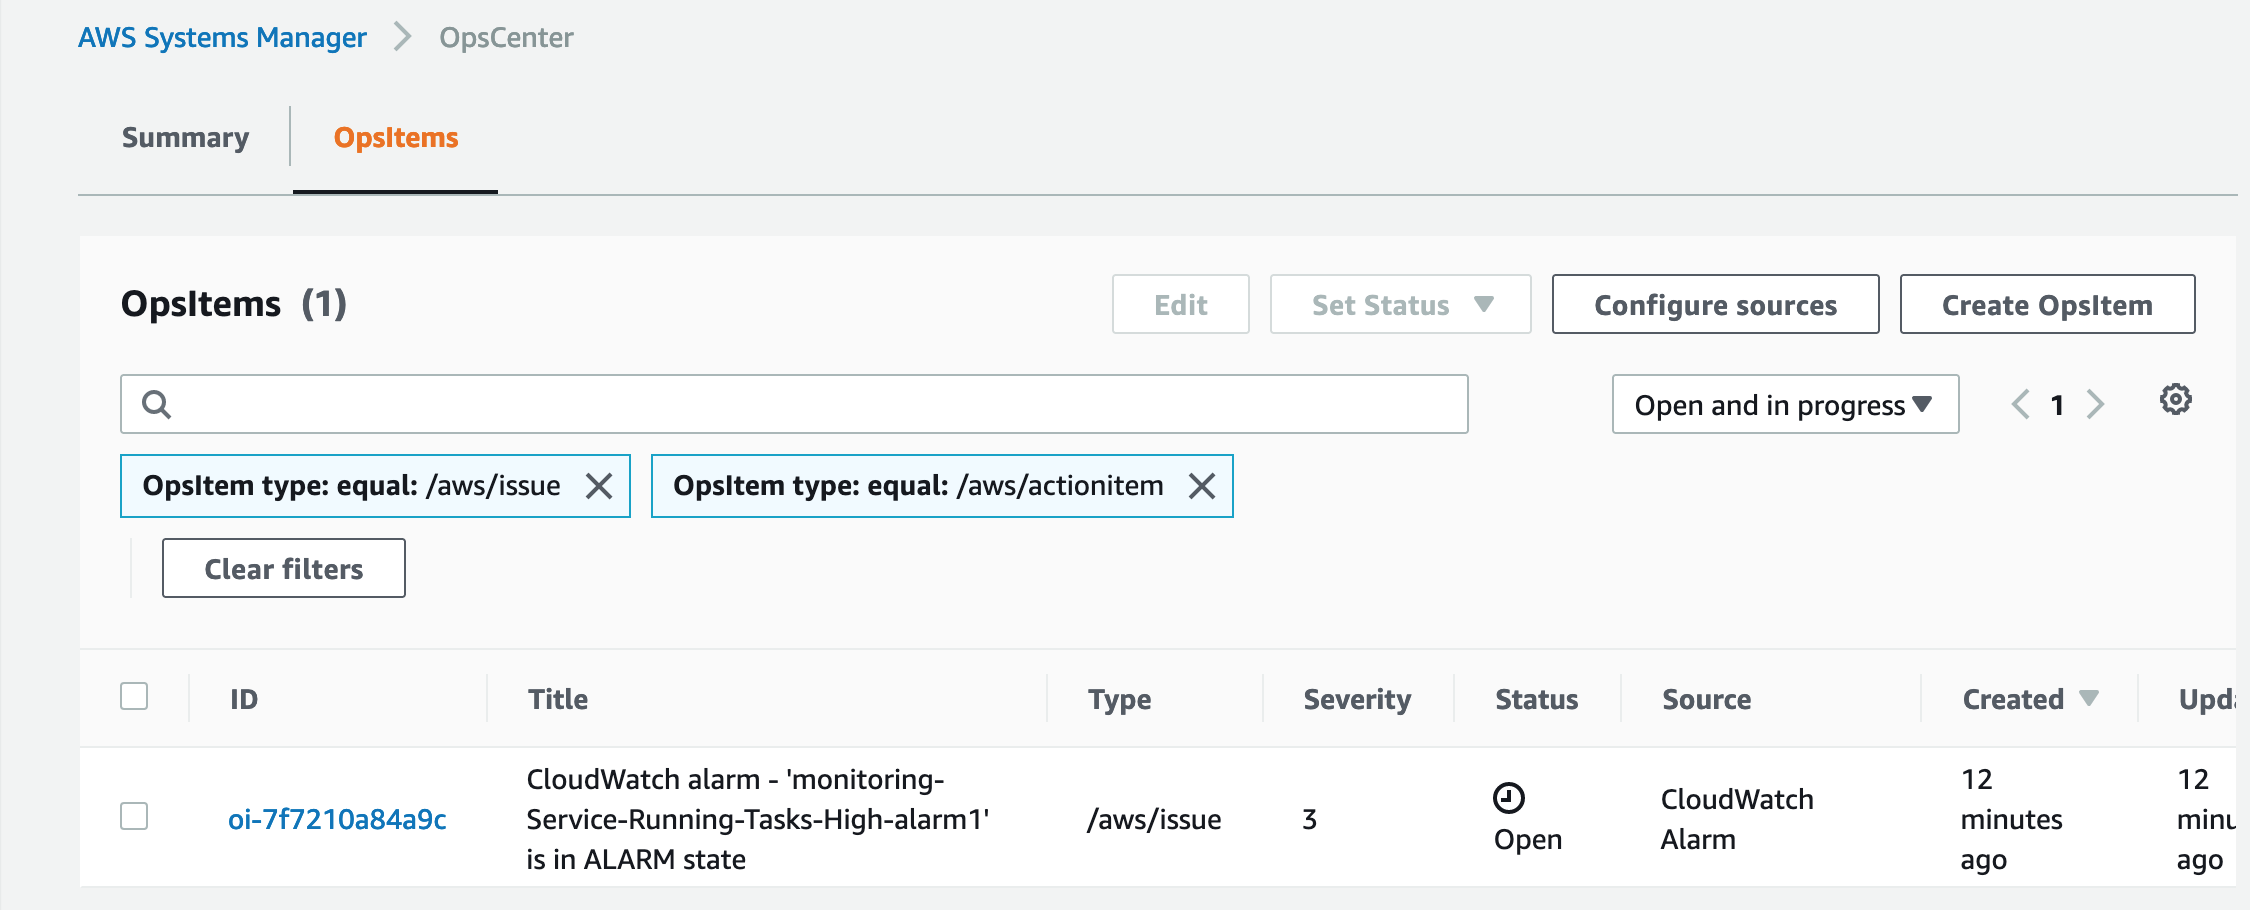
This is often handled by external solutions. It is also possible to use AWS services for this, like AWS Systems Manager OpsCenter. We can add some code to include sending alarm info to OpsCenter also, besides the SNS topic, with an override on the default alarm strategy on our alarm.
Deploying this code will allow the alarm to be visible at the OpsCenter dashboard as well!
alarm_actions = []
alarm_actions.append(OpsItemAlarmActionStrategy(OpsItemSeverity.MEDIUM, OpsItemCategory.PERFORMANCE))
if monitoring_config.default_alarm_topic:
    alarm_actions.append(SnsAlarmActionStrategy(
        on_alarm_topic=monitoring_config.default_alarm_topic,
        on_ok_topic=monitoring_config.default_alarm_topic))

mon["handler"].monitor_fargate_service(
    fargate_service=service,
    human_readable_name='My test service',
    add_running_task_count_alarm={
        'alarm1': cdkmon.RunningTaskCountThreshold(
            max_running_tasks=2,
            comparison_operator_override=cw.ComparisonOperator.LESS_THAN_THRESHOLD,
            evaluation_periods=2,
            datapoints_to_alarm=2,
            period=cdk.Duration.minutes(5),
        )
    })
9.3 Summary and final words
In this chapter, we took an add-on library for AWS CDK to facilitate monitoring of our solution infrastructure. With that, we set up a dashboard with a few widgets for monitoring visualization.
We also added an alarm with notification via SNS topic and to AWS Systems Manager OpsCenter.
We have kept the solution small and simple in this book, and kept all infrastructure in the same stack. In a real-world setting, we may have multiple stacks, each dedicated to a specific group of resources.
We would also likely add some automation for the provisioning of the infrastructure. This is, however, beyond the scope of this book. I hope you have enjoyed this book, and it has provided some value to you. If it has, I would be happy to know more! If it has not, I would be happy to know about that as well! We need feedback to improve.
Do not forget to remove the infrastructure you have provisioned here!
Thank you for your time!
/Erik